

In parts 1 and 2 of this series, we explored some of the initial questions that highlight the crisis in innovation we are facing in Mexico as well as the educational environment in which these questions play out. [1] [2] Both our investment in innovation as well as our educational landscape have had some real and profound interplays with our socioeconomic outlook in Mexico. In this strategic analysis series, we have colleagues much more qualified to go into depth on the policy and political implications of what we will discuss here. We will merely present some of these indicators as gauges of the profound impacts that our lack of innovation investment and often misguided educational processes have had in Mexico.
A troubling indicator dyad describes the working conditions faced by the entire country. The first, shown in Figure 1 has the average Mexican employee working 2150 hours per year, or roughly 41 hours a week, every single week of the year. [3] That is a full-time workweek with no days or weeks off relative to most of the developed world. In fairness, because Mexico’s federally mandated workweek is 48 hours, the average worker is working less than the federally mandated 48 hours. In absolute numbers, we far outpace Germany, with a difference around 800 hours per year. Mexico has even managed to work 150+ hours more per year than South Korea, a country where overwork is so rampant that the government had to set a government-enforced cap of 52 hours per week and the work stress is taking a measurable toll on the country’s wellbeing. [4]
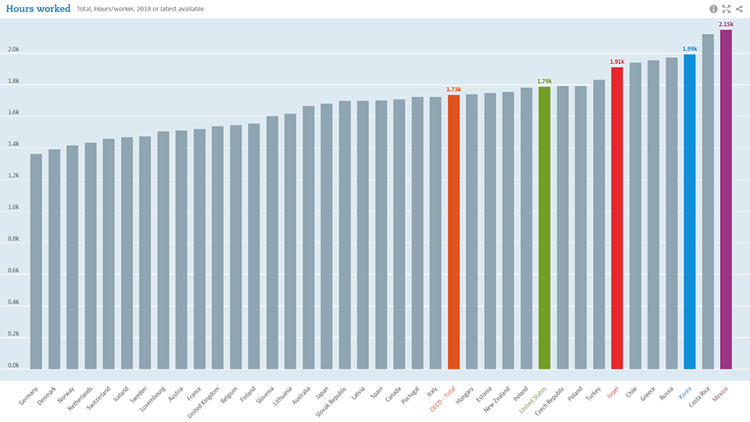
Figure 1 Hours worked per employee across selected OECD countries, with the average Mexican worker putting in an average of 420 more hours per year of work than the typical OECD worker. [3]
The second component in this indicator dyad is what makes this gargantuan work effort a worrying condition. Figure 2 shows the OECD’s estimate for wages per employee, where Mexico stands dead last in the OECD countries. [5] If one looks at wages, the USA:Mexico ratio is approximately 3.9:1, even though the per-capita GDP ratio is 6.7:1. The numbers provided by the Mexican government are even more dire, showing the average monthly wage of employees registered with Social Security at MXN$10,621.15 per month, or roughly USD$6,900 per year - nearly $10,000 less per year, or only 42% of the average wages calculated by the OECD! [6] Mexico’s wages are scaling much more poorly than its economy, and the inequalities that this condition can engender and entrench will have generational impacts on poverty and development.
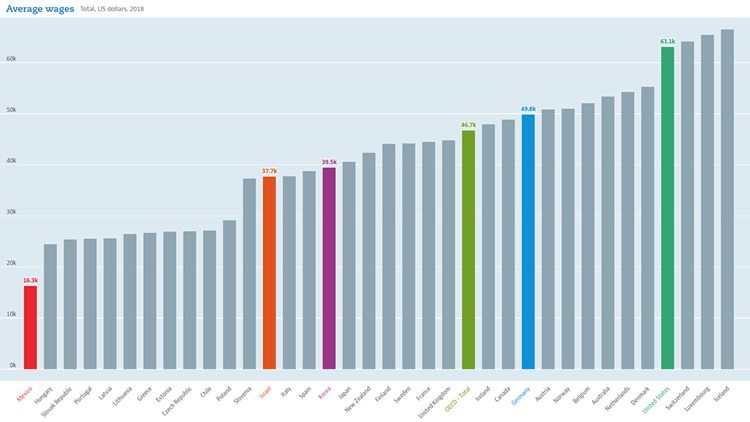
Figure 2 Average wages for selected OECD countries, with Mexico ranking dead last in the OECD. [5]
The inequalities do not stop with income, the gender gap in employment and education is also vast in Mexico. The OECD indicator on Youth Not in Employment, Education, or Training (NEET in OECD parlance or “ni-ni” in our local colloquialism) highlights a troubling gap between young men and women in Mexico. [7] The indicator divides youth into 15-19-year-olds (roughly high-school to early college), and 20-24-year-olds (college to early career). For Mexico, the percentages of NEET youth are 7.6% and 9.2% for men, respectively. For women, those numbers skyrocket to 20% and 36.6%, respectively. There are likely very complex economic and sociological reasons for this, but I personally suspect that the asymmetric burden of bearing children must have a least a significant impact in truncating such a large percentage of our young women’s futures by denying them employment, education, or training that could be the key to a better future.
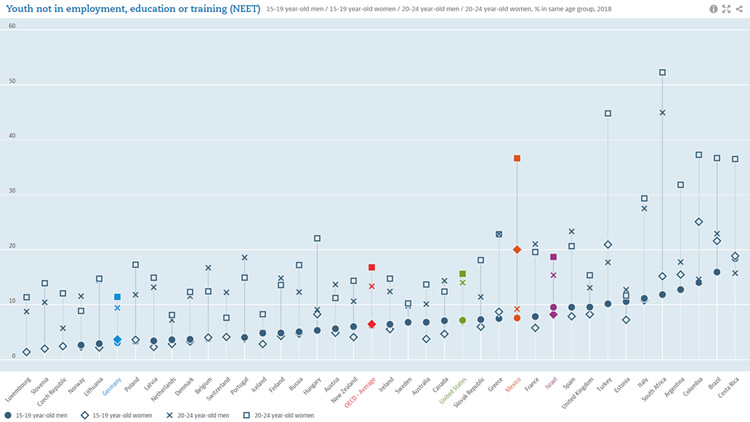
Figure 3 Youth Not in Employment, Education, or Training, OECD indicator, highlighting the wide gender gap in Mexico along these 3 important early career and economic development activities. [7]
In the educational sector, the gaps and inequalities are also majorly problematic for Mexico. In the OECD indicator for adult education (25-65-year-olds, or roughly the working-age population), right around the Greece mark (reading left-to-right in Figure 4), there are countries whose education profiles are “inverted” relative to the rest of the OECD. [8] That is, the terminal educational level for their adult working-age populations are primarily primary or secondary education, with secondary and tertiary educations taking a sharp dive. Mexico’s profile again stands out for its extremes among the OECD, with the second-lowest percentage of population having terminal tertiary education, and third-lowest percentage having secondary education as the terminal degree for the working-age population. 60.9% of working-age adults in Mexico only have a primary education as their preparatory tool to enter the modern marketplace, placing the entire country at a competitive disadvantage, and individuals at a severe risk of having their personal development prospects severely hampered for life.
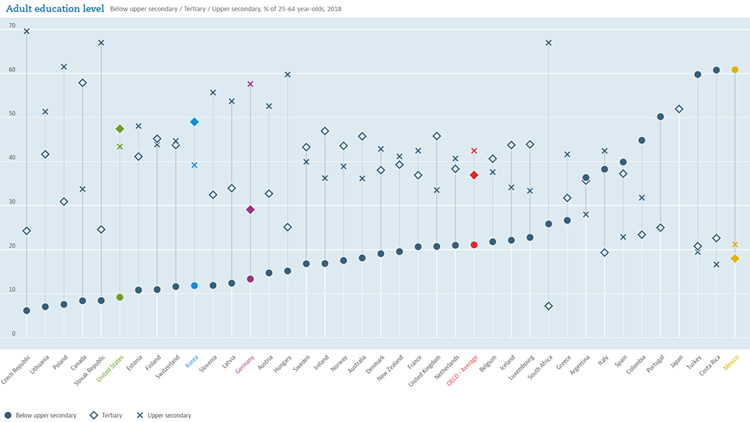
Figure 4 Adult education level for working-age adults (25-65 years old), OECD indicator. Argentina, Italy, Spain, Colombia, Portugal, Japan, Turkey, Costa Rica, and Mexico have "inverted" terminal education levels for their working-age populations. [8]
In our final figure for today’s analysis, we look at the kinds of industry that are currently the leading employers around the OECD. [9] As seen in Figure 5, the service sector is FAR outpacing the other economic activities, across the OECD and even in Mexico. Traditionally, the service industry sector was not considered one in which higher education was an absolute must-have for economic development, even if it was a tertiary sector of industry. And while today many service jobs continue to be those that could be done without much higher education and resources, the “intangibles” that constitute this sector are becoming increasingly wrapped up in advanced technologies. Developing apps, delivering new digital products and environments, creating entire interconnected ecosystems that complement and augment traditional industry, and the myriad similar processes all rely on ever more specialized and educated workers, at an ever-increasing rate. Creating the educational conditions in which we can guarantee tomorrow’s workforce in Mexico is prepared to face these challenges should have begun decades ago – we have zero time to waste in bringing about the best possible educational outcomes for today’s students.
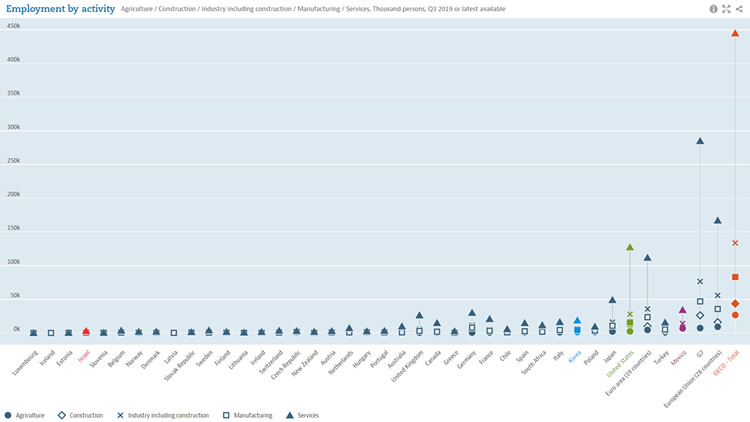
Figure 5 Employment by activity: agriculture, construction, industry (including construction), manufacturing, and services. Service jobs are outpacing all other forms of employment by wide margins. [9]
As challenging as these circumstances may be, the lessons we have covered in so many other articles in our Strategic Analysis series remain – where the challenges and deficiencies are the highest, biggest, and most dire – there also are the places where even small improvements can have outsized results. When we see huge challenges, we should also be capable of visualizing and even creating equally large opportunities.
Mexico’s talent continues to be encumbered by an endless slog of never-ending workweeks, drowning in largely cumbersome, sometimes obstructionist, generally antiquated, rigidly hierarchic, and frequently corrupt bureaucracy, without the economic and educational tools needed to begin creating pathways away from these poverty-perpetuating traps.
As we look forward to the next 50 years of being the Transforming University, it is our inescapable responsibility to ask ourselves at EVERY level of this organization the fundamental question:
“What will our short, medium, and long-term strategies and tactics be to tackle one or more
of the many areas of challenges and concomitant opportunities Mexico faces today?”
If we are to fulfill our mission of educating tomorrow’s culture-transforming leaders, then we must begin by demonstrating that leadership in every one of us who call UPAEP home and make that fundamental question our own personal mission.
I’m here today to report for duty…are you?
Referencias / References
[1] Juan Manuel López Oglesby, "Innovation in Crisis - Challenges and Opportunities part 1," Graduate School, UPAEP, Puebla, Science Strategy Position Paper 2019. [Online].https://upress.mx/index.php/opinion/editoriales/innovacion-y-tecnologia/5076-innovation-in-crisis-challenges-and-opportunities-part-1
[2] Juan Manuel López Oglesby, "Innovation in Crisis - Challenges and Opportunities part 2," Graduate School, UPAEP, Puebla, Science Strategy Position Paper 2019. [Online].
https://upress.mx/index.php/opinion/editoriales/innovacion-y-tecnologia/5154-innovation-in-crisis-challenges-and-opportunities-part-2
[3] OECD, "Hours Worked (indicator)," Indicator 2019.
[4] Su-Hyun Lee and Tiffany May, "Go Home, South Korea Tells Workers, as Stress Takes Its Toll," The New York Times, July 2018. [Online].
https://www.nytimes.com/2018/07/28/world/asia/south-korea-overwork-workweek.html
[5] OECD, "Average wages (indicator)," Indicator 2019.
[6] Comisión Nacional de los Salarios Mínimos (CONASAMI), "Salarios," CDMX, 2018. [Online].
https://www.gob.mx/cms/uploads/attachment/file/321592/Salarios-abril2018.pdf
[7] OECD, "Youth not in employment, education or training (NEET) (indicator)," Indicator 2019.
[8] OECD, "Ault education level (indicator)," Indicator 2019.
[9] OECD, "Employment by activity (indicator)," Indicator 2019.
|
Dr. Juan Manuel López Oglesby |
