

In part 1 of this series, we explored some of the initial questions that highlight the crisis in innovation we are facing in Mexico. [1] For part 2, we will look at how we stack up against some other educational indicators that can provide further depth to understanding the issues at hand. In the next section, we will look at some economic and public policy issues.
First, we explore the reality of the total number of researchers cited by the previous report. [1] That indicator was given in the number of researchers involved in R&D per million people in the country. But populations change, and that means that even a higher indicator at an earlier point in time means fewer absolute researchers. Figure 1 shows this decline in absolute numbers of people involved in R&D dropping from 43,942 in 2005 when the population of Mexico was 108.5 million to 29,890 in 2013 when the population had grown to 122.5 million. That 32% decrease in absolute numbers is exacerbated by the growth in population, worsening the indicator.
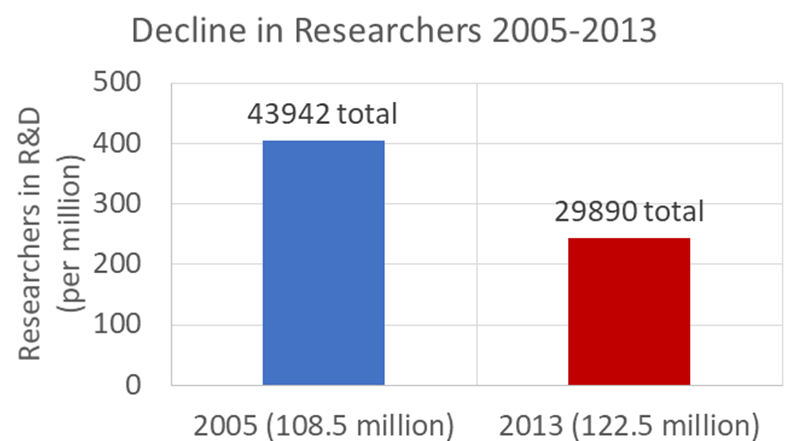
Figure 1 Total number of researchers expressed by the World Bank/UNESCO indicator [2], accounting for the variance in population over the reported years. [3]
This decline in absolute numbers stands in stark contrast to what is being reported by the CONACyT. This federal organism which is responsible for funding a very large proportion of science and innovation in the country has reported a steady increase in SNI fellows that hovers in the space between linear and exponential/power growth over its entire history, as seen in Figure 2. [4]
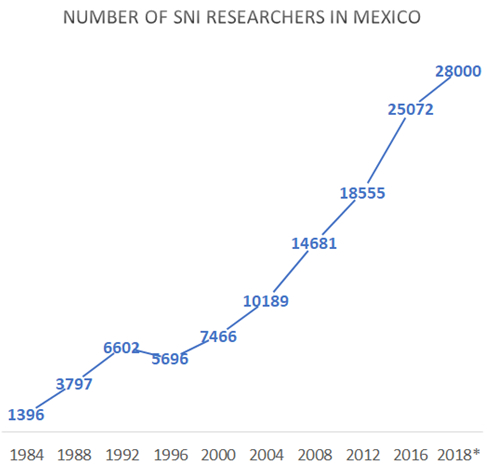
Figure 2 Number of SNI researchers from the inception of the program in 1984. Data for select years shown for clarity. *2018 and 2019 data are estimated. 2019 data not shown to keep time scales on the graph, but is approximately 30,000 SNI researchers. [4]
Given that the number of federally funded academics has risen so steadily and dramatically while the overall national outcome of R&D investment and human resources has sharply declined, a closer look at educational indicators and outcomes is warranted.
Upon release of the COMEPO report on the state of graduate programs in the south-central region of Mexico in which UPAEP is located, initial impressions were that it highlighted a low Science, Technology, Engineering, and Mathematics (STEM) education indicator. [5] This seemed even starker when realizing that the Engineering disciplines accounting for only 15% of all graduate programs in the region. A country with quite a bit of publicly available data across many kinds of reports is the USA, and so the data were queried to see if our regional educational mix could be a major player in the innovation crisis we are seeing for Mexico. [6] [7] The results are shown in Figure 3.
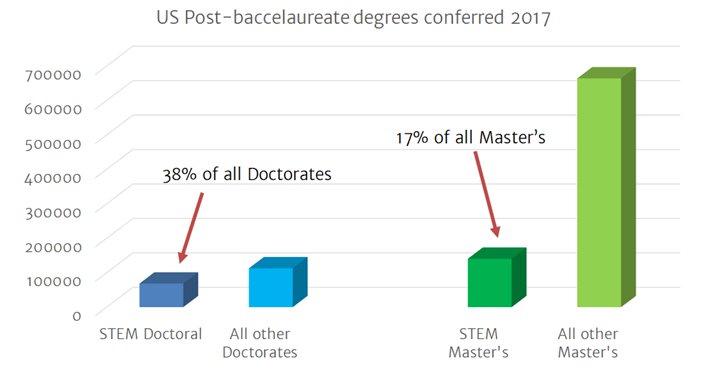
Figure 3 US Graduate degrees broken out by educational level and STEM vs. all other fields for degrees conferred in 2017. [6] [7]
The data for the USA are broken down by Master’s and Doctoral-level degrees, while the COMEPO report aggregated both. [6] [7] [5] What was surprising from this comparison was that the mix of STEM vs non-STEM did not appear to be highly anomalous in aggregate compared to the mix of degrees being awarded in the USA. Figure 4 from the COMPEPO report’s “Gráfica 20” (figure 20) shows approximately 25.4% of the educational programs being offered in STEM. However, the provided graph showed only the degree programs offered, and not the degrees conferred, as the data from the US showed. The COMEPO report contained a separate table (Tabla 1), which contained this information in tabular form which was converted into a graph for easier comparison in Figure 5.;
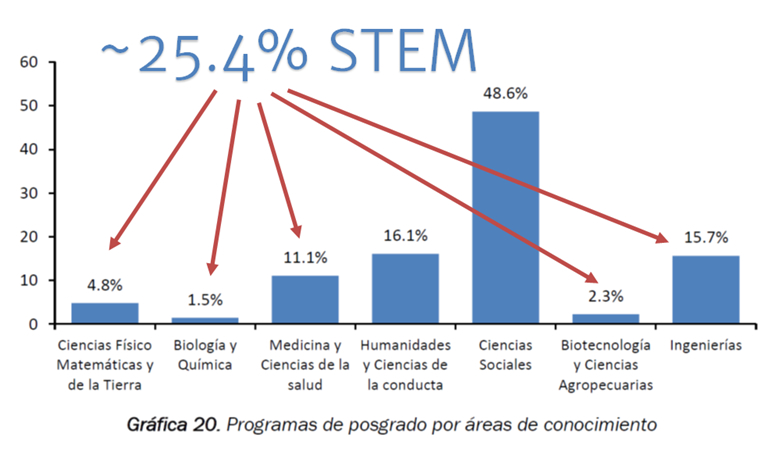
Figure 4 Graduate programs in the south-central region of Mexico, broken down by primary field of study. This chart was taken from the publicly available COMEPO report produced by UPAEP and annotated to show the fields included in the broader category of "STEM". [5]
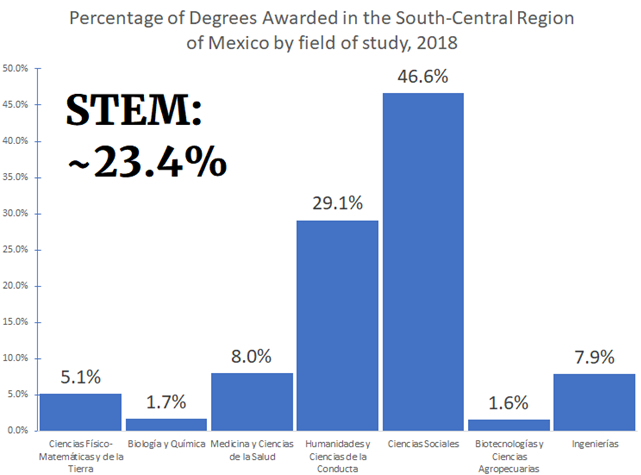
Figure 5 Percentage of degrees awarded in the South-Central region of Mexico, by field of study (2018). Graph built from Table 1 (Tabla 1) in the COMEPO report on the region. [5] Approximately 23.4% of awarded degrees were in STEM.
As we might expect, the number of degrees awarded don’t match up exactly with the programs offered, but the overall mix remains relatively similar in STEM vs. Non-STEM. So, our balance – at least in our local context vs. the USA – seems to not be too far from where we might need to be competitive. In the next section, we will dig deeper into the public policy issues that surround these questions, but we can begin with considering the data presented in Figure 6. Even if our universities are investing similar relative efforts in the different fields of study as a major innovation hub like the USA, we simply are not educating enough people in each of these positions. Figure 6 is an indicator by the OECD, showing the percentage of the population with tertiary education (post-high school education: both undergraduate and graduate). Mexico is at the low end of this educational indicator, at roughly 22% for the younger population and 13% for the older (near retirement age) population. To get to the OECD average, Mexico would have to double the number of people achieving tertiary education in the country and triple this number to rival the world’s #4 innovator, South Korea.
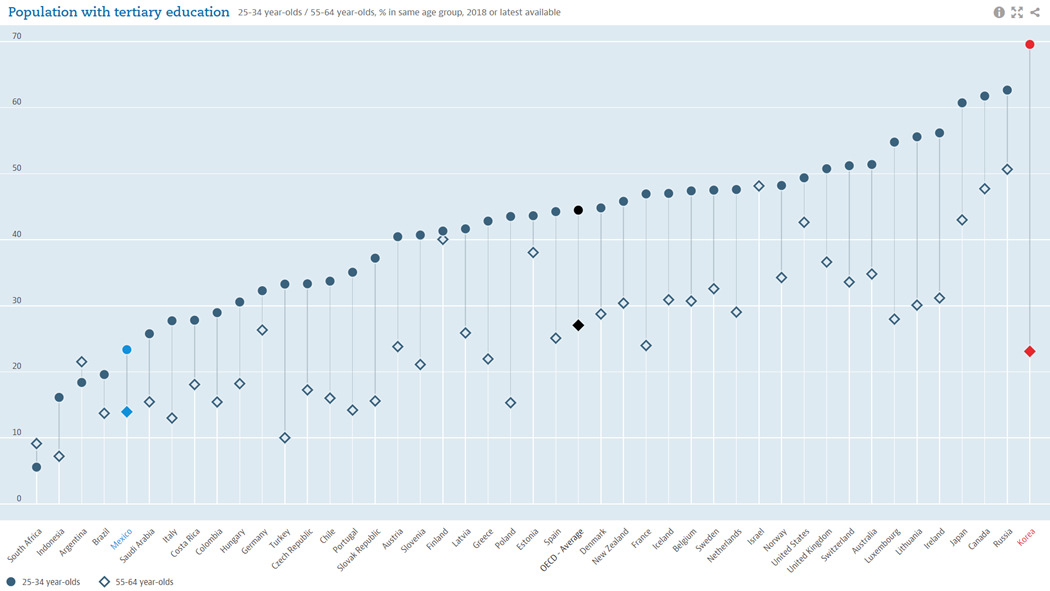
Figure 6 Population with tertiary education 25-34 and 55-64-year-olds. Mexico, OECD Average, and Korea highlighted. [8]
Thorny problems such as doubling or tripling the percentage of a population with a college or graduate degree, along with the questions of funding, infrastructure, teaching, and employment of these graduates cannot be undertaken without tackling some of the underlying public policy issues at stake. That discussion will be continued in part 3 of this series.
Referencias / References
[1] Juan Manuel López Oglesby, "Innovation in Crisis - Challenges and Opportunities part 1," Graduate School, UPAEP, Puebla, Science Strategy Position Paper 2019. [Online].https://upress.mx/index.php/opinion/editoriales/innovacion-y-tecnologia/5076-innovation-in-crisis-challenges-and-opportunities-part-1
[2] UNESCO Institute for Statistics, "Researchers in R&D (per million people)," World Bank, Statistical Indicator 2017. [Online]. https://data.worldbank.org/indicator/SP.POP.SCIE.RD.P6
https://data.worldbank.org/indicator/SP.POP.SCIE.RD.P6
[3] The World Bank, "Population, total (Mexico)," The World Bank, Indicator 2019. [Online].
https://data.worldbank.org/indicator/SP.POP.TOTL?locations=MX
[4] Carlos Erwin Rodríguez Hernández Vela, "El Sistema Nacional de Investigadores en números," FCCyT, CDMX, Historical Review and Statistical Summary 2016. [Online].
http://www.foroconsultivo.org.mx/libros_editados/SNI_en_numeros.pdf
[5] Consejo Mexicano de Estudios de Posgrado, A.C. (COMEPO) / Universidad Popular Autónoma del Estado de Puebla, A.C. (UPAEP), Diagnóstico del Posgrado en México Región Centro Sur, 1st ed., Eugenio Urrutia Albisua et al., Eds. Ciudad de México, Ciudad de México, México: COMEPO, 2019. [Online].
www.comepo.org.mx/images/diagnostico/diagnostico-posgrado-mexico-region-centro-sur.pdf
[6] U.S. Department of Education, "Table 323.10 Master's degrees conferred by postsecondary institutions, by field of study: Selected years, 1970-71 through 2014-15," National Center for Education Statistics, Washington, D.C., Survey 2019. [Online].
https://nces.ed.gov/programs/digest/d16/tables/dt16_323.10.asp
[7] U.S. Department of Education, "Table 324.10 Doctor's degrees conferred by postsecondary institutions, by field of study: Selected years, 1970-71 through 2016-17," National Center for Education Statistics, Washington, D.C., Survey 2019. [Online].
https://nces.ed.gov/programs/digest/d18/tables/dt18_324.10.asp
[8] OECD, "Population with tertiary education (indicator)," OECD, Indicator 2019. [Online].
https://data.oecd.org/eduatt/population-with-tertiary-education.htm
|
Dr. Juan Manuel López Oglesby |
